1800 425 9515
 471, Road No. 87, Paramount Hills, Jubilee Hills, Hyderabad, Telangana 500096
 Call us
 Email address
info@sandor.co.in
NI Medical provides continuous, accurate and non-invasive hemodynamic monitoring. It is based on the Whole-body Impedance Cardiography, a technology that was developed by NI Medical’s scientists over years of research and development following by extensive testing and validation.
Key Features
- 100% noninvasive CARDIAC SYSTEM, easy to use – no need for patient to undress.
- A multi-dimensional graphic display of patient’s fluids, hemodynamic status and Cardio-pulmonary Function.
- The only Impedance technology that meets FDA guidelines for statistical bioequivalent to thermodilution.
- Regional Impedance Cardiography – the only technology that measures continuous Stroke Volume, Cardiac Output, Cardiac Power Index, Total Peripheral Resistance, Left ventricular systolic function and Total Body Water.
- Enables to determine patient’s Preload, Contractility or Afterload which can lead to an effective management of fluids, catecholamine and inotropes.
- Provides Real-Time data on patient Hemodynamic Parameters.
- Strong and clean signal, taken from the radial and posterior tibialis arteries, results in high accuracy and reproducibility.
Clinical Applications
Congestive Heart Failure
Highlights of NICaS advantages:
- NICaS can effectively reduce heart failure admissions and readmissions back to the hospital
- NICaS is accurate, but more importantly, it is consistent
- NICaS takes the guesswork out of managing difficult patients with heart failure
- NICaS affords a comfort level for medication titration not previously seen in these patients
- NICaS will identify patients with impending heart failure before they decompensate allowing time to make necessary adjustments that will prevent the decompensation of inadequate delivery of oxygen and nutrients to the tissues of the body, which can be due to a pumping or a relaxing problem of the heart.
Heart failure affects over 6 million people in the United States with about 700,000 new cases annually. The majority of admissions to the hospitals for heart failure are, in fact, readmissions for heart failure. Approximately 22% of people discharged from the hospitals with heart failure will be readmitted within 30 days and approximately 50% will be readmitted within 6 months.
The reasons for the huge financial and functional burden of heart failure are many including an incomplete understanding of the pathophysiology of heart failure, misdiagnoses, suboptimal use of evidence-based therapies and lack of a clinically useful, accurate and consistent means of assessing one’s cardiovascular physiology in real-time.
NICaS could be just the solution to address all of these limitations.
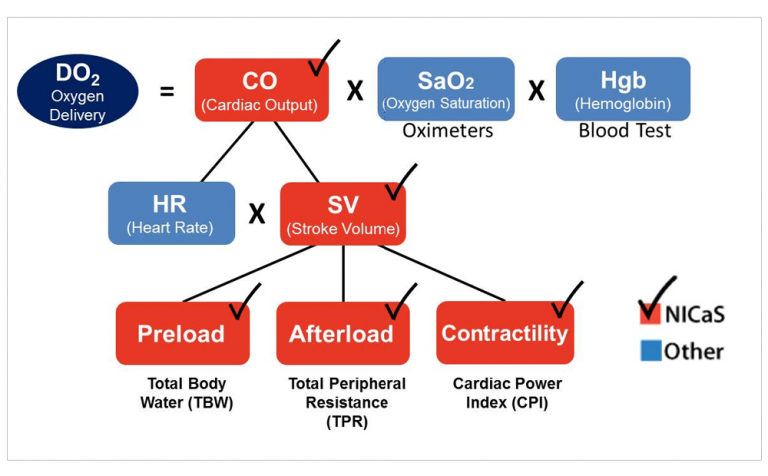
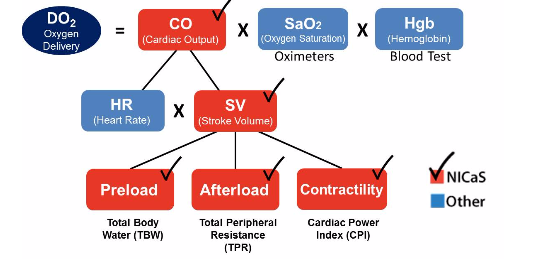
From a clinical standpoint, NICaS is able to provide accurate (highly correlates with pulmonary artery catheter), consistent and real-time date of one’s cardiovascular physiology. This would facilitate the ability to improve our understanding of one’s cardiovascular state, provide a clue as to what is causing the current state and Heart Failure, facilitate titration of medication to more optimal levels and provide a mean of assessing one’s response to medication adjustments. When coupled with physician or nurse practitioner with a strong understanding of basic cardiovascular physiology, NICaS has the potential to revolutionize the management of both chronical and acute heart failure and to, more importantly, improve outcomes for patients with this dreaded syndrome. See Figure 1 for the physiology of oxygen delivery as can provided by NICaS
Case Study
Heart Failure Patient in the community
A heart failure patient comes to his cardiologists for a routine checkup. NICaS inspection reveals low contractility and high afterload. Total Body Water was normal. NICaS identified impending heart failure just before decompensation. See Figure 1 for patient’s first NICaS inspection report.
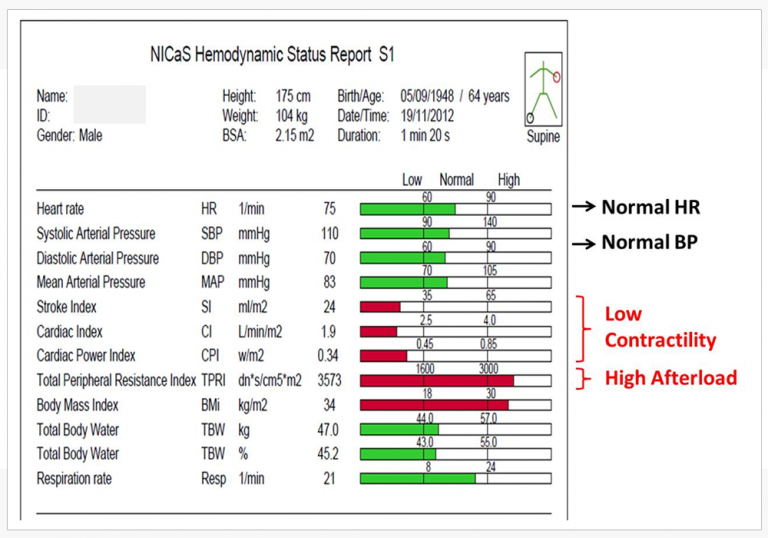
NICaS first inspection Delivery
Based on NICaS inspection results, the cardiologist prescribe ACE Inhibitor. In addition, a low salt diet was recommended.
2 month later, the patients arrived to the cardiologist for a second visit. NICaS second inspection verified that afterload was reduced and contractility was improved, both in to normal range. The decompensation was prevented and could be that potential hospitalization was prevented. See Figure 2 for patient’s second NICaS inspection reports.
Hypertension Control
What Is High Blood Pressure?
- Blood pressure is the force of blood pushing against the walls of the arteries as the heart pumps blood. If this pressure rises and stays high over time (Hypertension), it can damage your heart, blood vessels, kidney and other parts of your body.
What Cause Hypertension?
- Hypertension is commonly caused by hemodynamic abnormalities associated with high Peripheral Resistance, High Cardiac Output, high Total Body Water (TBW) or a combination of these factors. Figure 1 illustrates the physiology of Hypertension.

Figure 1: The Physiology of Hypertension
Blood Pressure Numbers
- Blood pressure is measured as systolic and diastolic pressures. “Systolic” refers to blood pressure when the heart beats while pumping blood. “Diastolic” refers to blood pressure when the heart is at rest between beats.
- The table below shows categories for blood pressure levels in adults (measured in millimeters of mercury or mmHg). It also shows which numbers put you at greater risk for health problems. See Figure 2 for blood pressure values.
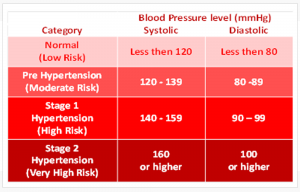
Figure 2: High blood pressure values
How Hypertension is Currently Being Treated?
- Due to lack of reliable instrumentation capable of measuring hemodynamic abnormalities, doctors, to a certain extent, are force to work in the dark resulting compromised treatment.
What is NICaS Inspection?
- NICaS is a revolutionary device that is capable of indicating the exact cause of hypertension based on objective hemodynamic parameters.
- What are the Benefits of NICaS Inspection?
- Enable your doctor to provide you the exact treatment that will maximized your Hypertension control.
- Enable your doctor to trend over time the effectiveness of your treatment and adjust treatment accordingly.
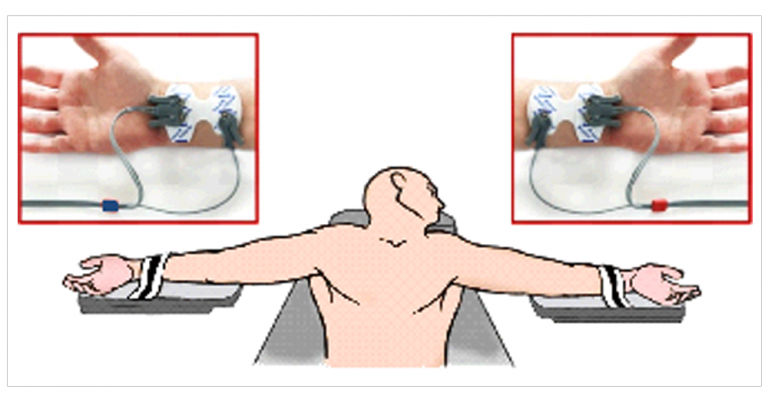
How NICaS Inspection Is Done?
- NICaS inspection is very simple: all you need to do is lay down (no need to undress!), two sensors will be attached to your left wrist and right ankle and the results will appear in just 2 minutes.
- The inspection is FDA cleared, very accurate, not invasive, no radiation and absolutely no pains.
Case Study: Hypertension
2 Hypertension patients are under evaluation:
Patient A: blood pressure – 176/76 and patient B: blood pressure – 210/98
Additional data available for the physician includes:
Attention: The internal data of table “4” is corrupted!
NICaS inspection reveal that Patient A is Vasoconstricted (low Cardiac Index and high Peripheral Resistance) and Patient B in Hyperdynamic with high Cardiac Index and normal Peripheral Resistance. See Figure 3 for NICaS measurement report of both patients.
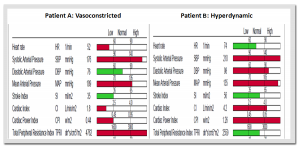
Figure 3: NICaS measurement reports
NICaS additional information suggest that patient A is Vasoconstricted therefore needs Vasodilator agents (such as ACEI or ARB) and patient B is Hyperdynamic therefore needs negative inotropic agents (such as BB or CCB)
References:
- Hector O. Ventura, Sandra J. Taler and John E. Strobeck. Hypertension as a Hemodynamic Disease: The Role of Impedance Cardiography in Diagnostic, Prognostic and Therapeutic Decision Making. American Journal of Hypertension 18, No. 2, Part 2:26S-43S, February 2005
- Ronald D. Smith et al. Value of Noninvasive Hemodynamics to Achieve Blood Pressure Control in Hypertension Subjects. Hypertension 2006;47:771-777, Mar 6, 2006
CRT Implantation and Optimization
Cardiac Resynchronization Therapy (CRT) is being used more and more as a therapy method for HF problems rather than therapy of arrhythmia problems as is done by AV pacemakers.
Currently, the use of CRT suffers from 2 major problems:
- High rate (30%) of non responsive patient for CRT implantation.
- Lacking of a simple and easy to use method for CRT optimization results in compromised Cardiac Output improvement and reduced rate of success in solving HF problems.
Bioimpedance cardiograph can provide a good solution for CRT optimization (1).
NICaS is a superior device for this application in comparison to other bioimpedance devices due to its high accuracy as well as reproducibility and its wrist – ankle sensors configuration that keep the thorax area free of sensors.
As a result, the NICaS can solve these 2 major problems.
High rate of non responders
Non responders are in many cases the results of a compromised location of the electrodes in the right atrium, and both ventricles. NICaS can provide left ventricular contraction feedback during the implantation, resulting in the ability to locate the electrodes at more responsive locations and reducing rate of non responders.
Optimization
By obtaining a continuous Cardiac Output reading by using the NICaS, AV and VV delays can be set so that Cardiac Output can be maximized. See Figure 1 for NICaS Comparative Screen during CRT optimization.
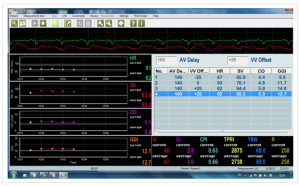 NICaS Comparative Screen utilized for CRT optimization
References:
- Konstantin M. Heinroth at el: Impedance Cardiography: a useful and reliable tool in optimization of CRT; Europace 2007 9,744-750
- Serge Barold at el: Echocardiographic optimization of the atrioventricular and interventricular intervals during cardiac resynchronization; Europace 2008 10,88-95
- Robert G. Turcott et al, Measurement Precision in the Optimization of Cardiac Resynchronization Therapy, Circulation Heart Failure 2010;3:395-404, February 22, 2010
Hemodynamics monitoring during anesthesia
Stroke Volume, Cardiac Output and Total Peripheral Resistance are major vital signs that can be of great help if monitored continuously during anesthesia.
The common practice of measuring these parameters involved the insertion of a catheter which creates additional complication and risk. As a result, the utilization of such catheter is limited to special cases only.
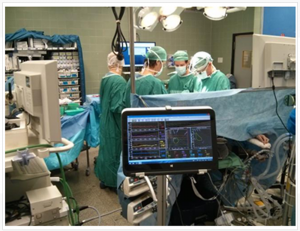
NICaS (Non Invasive Cardiac System) can monitor these parameters by means of just 2 sensors placed on patient both wrists. This noninvasive, easy to use and low cost technology can be a useful solution to provide anesthesiologist a better understanding of patients hemodynamics.
NICaS sensors connection during surgery
Non Invasive Cardiac Output
Non Invasive Cardiac Output is the amount of blood pumped by the heart in one minute. Cardiac output – It is the product of heart rate x Stroke volume and is expressed in absolute terms of liters / minute (l/min). Cardiac output can be normalized for body size by divided cardiac output by body surface area (BSA) and is named cardiac index. The advantage of normalizing cardiac output for BSA is that the normal range would apply to all patients, regardless of size. For example, a large male might have a non invasive cardiac output of 6.8 l/min and a small female might have a cardiac output of 3.4 l/min. However, when normalized for body size, both might have a cardiac index of 3.0 l/min.
One of the major factors which affect Non Invasive Cardiac Output is the metabolic rate of the body. Consequently, factors that affect the metabolic rate also affect the Non Invasive Cardiac Output. For example:
Age: metabolic rate is highest in youth and gradually decreases with age. For example, a cardiac index of 4.5 l/min/m2 is normal for a 7 year old, while 2.5 l/min/m2 is normal for a 70 year old. Cardiac Index decreases by about 5% per decade from age 20 to age 70.
Posture: cardiac output will decrease by approximately 10% when a person changes from a lying to a sitting position and approximately 20% from a lying to a standing position.
Exercise: In well-conditioned elite athletes, cardiac output may increase six-fold from rest to maximal exercise. In other words, the resting cardiac output of 5 l/min may increase to 30 l/min at maximal exercise.
Body Temperature: High body temperature or fever will cause an increase in cardiac output. Low body temperature will result in a lowering of cardiac output (unless the patient begins to shiver, which increases metabolic needs of the muscles and will result in increasing cardiac output). In some surgical procedures, such as coronary artery bypass surgery, the patient’s body temperature is purposely lowered to decrease the metabolic and, consequently, cardiac demands during the procedure.
Body Size and Composition: The larger a person’s body size, the greater the cardiac output will be. For example, a cardiac output of 10 l/min may be normal for a person weighing 120 kg, while 4 l/min may be normal for a person weighing 50 kg.
Gender: Because males typically have more muscle mass than females, the resting cardiac output of males will normally be higher than the cardiac output of females. For example, a male who weighs 80 kg would normally have a higher resting cardiac output (approximately 10%) than a female who also weighs 80 kg.
Environmental Temperature and Humidity: As the body’s core temperature increases or decreases, the cardiovascular system responds to maintain the desired core temperature. Reflex changes occur not only in cardiac output, but also in many other parameters including systemic vascular resistance. To achieve the desired body temperature, cardiac output is either increased or decreased and blood flow to the skin is either increased to cool the body or decreased to maintain body temperature.
Critically Ill / Post Surgery: The body’s metabolic demands increase significantly when the body is ill or traumatized. In critically ill or post-surgical patients, it is very common to see cardiac output higher than normal (increases of 50% or more are not uncommon).
Diseases: Diseases, such as hyperthyroidism or hypothyroidism (abnormal function of the thyroid gland), will also affect cardiac output.
Psychological Factors: Strong emotions, such as fear and anxiety, also result in increased cardiac output, even though the body’s metabolic demands have not appreciably changed. This is known as the “fight or flight” syndrome, since the body is physiologically preparing to fight or flee. For example, if you are very nervous about demonstrating the NICaS to a group of doctors and nurses and if you hook yourself up to the NICaS, your hemodynamic parameters will be much higher than they would normally be at rest. Another very common example of psychological factors affecting physiological parameters is the “anticipatory response.” When a person begins thinking about strenuous exercise, the cardiovascular system begins to increase its function to prepare the body for the increased metabolic demands of exercise. An excellent example of this is a sprinter preparing for a 100-meter dash. When he is in the starting blocks prior to the start of the race, his metabolic demands are very low; however, his heart rate, blood pressure, cardiac output are extremely high as his body anticipates the increased metabolic demands that will occur when the race starts.
Cardiac output is an extremely informative physiological parameter. Changes in cardiac output can provide a much earlier warning of significant changes in the body’s function or metabolic needs than changes in blood pressure. For example, cardiac output may change as much as 30% before any changes are noted in blood pressure. This is due to reflex cardiovascular changes (vasoconstriction and vasodilation) that attempt to maintain a stable blood pressure.
While monitoring critically ill patients, it is important to remember that the metabolic needs of these patients are much greater than healthy persons of the same size. Consequently, a cardiac index of 2.0 – 3.0 l/min for a critically ill patient could be life-threatening, even though 2.5 l/min is usually considered within normal limits. In addition, a sudden reduction in a patient’s cardiac output/index could be life-threatening. In general, cardiac index values of less than 1.8 l/min/m2 are considered extremely serious and values less than 1.0 l/min/m2 are not sufficient to sustain life.
Cardiac output may be increased by modifying any of the underlying parameters that affect the cardiac output. These include increasing heart rate, increasing stroke volume by increasing preload (end diastolic volume), contractility (speed and strength of contraction of the left ventricle) or decreasing afterload (systemic vascular resistance).
Unlike the “gold standard” of measuring cardiac output that require the insertion of a catheter into the heart, NICaS offer a simple and non-invasive way to measure cardiac output. This enable clinicians at all levels of healthcare to measure cardiac output.
Non Invasive Stroke Volume
Non Invasive Stroke Volume is the amount of blood (in ml) pumped by the left ventricle each heartbeat. Stroke index is the stroke volume divided by Body Surface Area (BSA), to normalize it for body size. Normal rage of Stroke volume is 60 – 130 ml and normal range of Stroke index is 35 – 65 ml/m2.
There are three primary factors that determine stroke volume. These are preload, contractility, and afterload.
Preload refers to the amount of blood in the ventricle at the end of diastolic filling, which is also known as “End Diastolic Volume” (EDV). EDV is affected by several parameters including amount of circulating blood, venomotor tone (venous resistance), diastolic filling time (which is determined by heart rate), and posture. The more blood available and the longer the ventricle has to fill, the greater EDV.
Myocardial contractility is determined by the intrinsic force-velocity relationship of the myocardial muscle fibers. The contractile state of the heart may be affected by neural (parasympathetic or sympathetic nerve stimulation) and/or humoral (substances in the blood stream secreted by the body systems (e.g., epinephrine)), or pharmacological agents, such as positive inotropes like digitalis).
Afterload refers to the amount of resistance to blood flow in the arterial system. The overall resistance is determined by the diameter of the aortic valve, distensibility of the aorta, and degree of constriction/dilation of the arterial system. When other factors are held constant, the greater the resistance, the less volume will be ejected with each heartbeat.
Stroke Volume role in the physiology of delivered O2
There are two primary reasons Stroke volume may be low: hypovolemia (low blood volume, which results in low preload) and left ventricular dysfunction (poor myocardial contractility). Consequently, changes in Stroke volume can be early indicators of changes in blood volume and myocardial contractility. These changes will occur earlier than changes in cardiac output.
The usage of Stroke volume is limited as the measurement of Stroke volume is complicated and expensive.
NICaS can measure Stroke volume by only attaching 2 sensors to patient’s two limbs.
For more details click here.
This enables clinicians, at all levels of healthcare, to utilize Stroke Volume as an early indicator of changes in blood volume and myocardial contractility.
Hemodynamic Monitoring
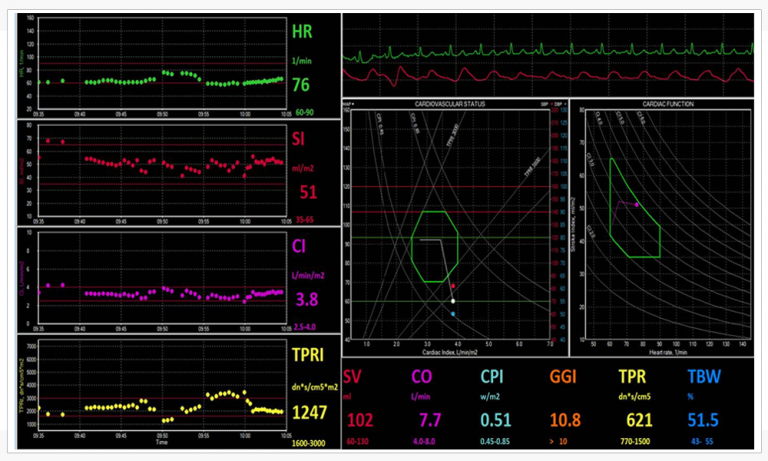
Our approach for Hemodynamic monitoring includes noninvasive measurements of hemodynamic parameters by the Non Invasive Cardiac System (NICaS) and trend the data by the Hemodynamic Navigator™. The Hemodynamic Navigator™ is a novel multi-dimensional representation of the cardiovascular status. It provides a good understanding of the interrelations between the cardiac power and the vascular resistance, Hans enables to guide therapy of many cardiovascular syndromes into a better hemodynamic state.
The Hemodynamic Navigator consists of 2 graphs: Cardiovascular status and cardiac function.
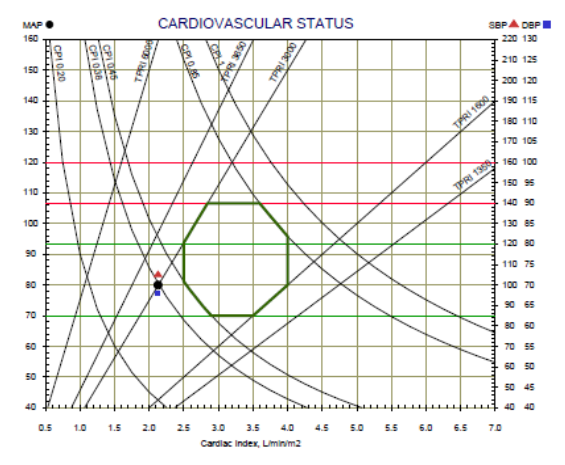
The Cardiovascular status graph consists of the Cardiac Output Index (CI) as the X-axis, the Blood pressure as the Y-axis and lines of Total Peripheral Resistance Index (TPRI) and Cardiac Power Index (CPI). In addition, the normal range is marked by green lines. Patient’s cardiovascular status represents by a black dot. A red triangle and a blue square represent the systolic and diastolic blood pressure respectively.
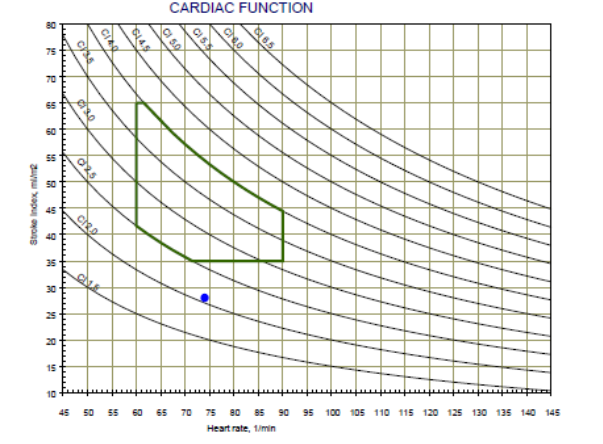
 The Cardiac Function graph consists of the Heart Rate (HR) in the X-axis, the Stroke Volume Index (SI) in the y-axis and lines of the Cardiac Output Index (CI). In addition, the normal range is marked by green lines. Patient’s cardiac function represents by a black dot.
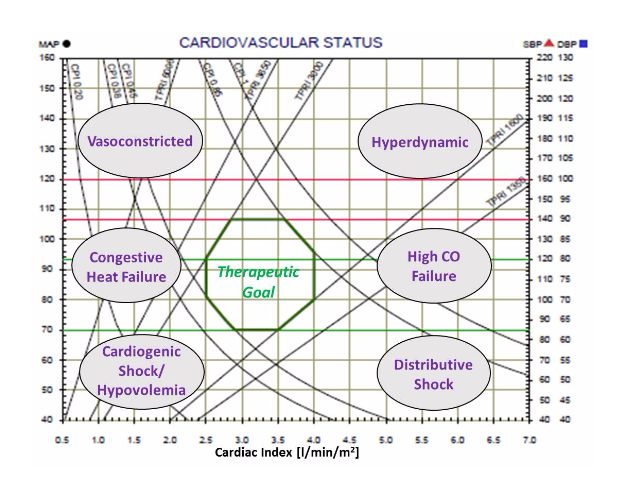
 The 2 graphs (Cardiovascular Status and Cardiac Function) provide a very clear understanding of patient’s pathophysiology by the location of the black dots. Various areas represent different syndromes, as can be seen on the graph below, while the respond to treatment or trend over time is very clear.
The Hemodynamic Navigator is very effective to manage patients with Hypertension, Congestive Heart Failure (CHF), Patients hospitalized in Internal Medicine and Cardiology departments. In addition, it is an effective tool support drug titration in ICU and ICCU.

Impedance Cardiography
Impedance Cardiography (ICG) is a noninvasive technology for measuring total electrical conductivity of the human body and its changes over time to process continuously a number of hemodynamic parameters such as Stroke Volume (SV), Heart Rate (HR), Cardiac Output (CO), Body water, Total peripheral Resistance (TPR) and Cardiac Power (CP).
Two basic technologies are currently in use for impedance cardiography:
- The Thoracic ICG, were the sensors are placed on the root of the neck and the lower part of the chest.
- The Whole-body or Regional ICG, were four pairs of sensors are used, one pair on each limb or only two pairs of sensors are used, performing best when placed on one wrist and on the contralateral ankle.
The most significant advantage of the Whole-body Impedance Cardiography – ICG in comparison to the Thoracic ICG is the use of the peripheral impedance signal for the calculation of the Stroke Volume. About 75% of the peripheral impedance waveform is borne by the systolic blood volume pulsation of the arterial vasculature of the upper and lower limbs, and the remaining 25% arrive from the trunk (thorax).
While the Whole-body Impedance Cardiography -ICG peripheral volumetric signal is borne throughout the length of the arterial tree, the Thoracic ICG waveform is generated by multiple sources including the aorta, lungs, vena cava, and artifacts due to heart movement.
As a result, the peripheral systolic impedance changes are more reliable then the thoracic impedance changes for calculating the cardiac stroke volume.
In addition, due to the use of peripheral signals, the responses to vasodilation therapy is better depicted by the Whole-body ICG (that is utilized by NICaS) when compared with a Thoracic Impedance Cardiography -ICG.
CHF Readmission Reduction
This letter is to serve as a brief synopsis of our experience with the Cardiac 360 program, which incorporates the NI-Medical Non Invasive Cardiac System (NICaS) impedance cardiography (ICG) device. We piloted this program at two nursing homes locations starting in January of 2014. In order to fully grasp the potential impact of using this program to assist in the assessment and management of residents with heart failure in the nursing home setting – Readmission Reduction – I will provide a brief overview of the burden of heart failure.
Heart failure is a syndrome of inadequate delivery of oxygen and nutrients to the tissues of the body, which can be due to a pumping or a relaxing problem of the heart. Many different cardiac disease states will present with heart failure. Heart failure affects over 6 million people in the United States with about 700,000 new cases annually. The majority of admissions to the hospital for heart failure are, in fact, readmissions for heart failure. Approximately 22% of people discharged from the hospital with heart failure will be readmitted within 30 days and approximately 50% will be readmitted within 6 months. Heart failure is the number one Medicare discharge diagnosis and the direct and indirect costs of heart failure are about $40 billion annually.
The reasons for the huge financial and functional burden of heart failure are many including an incomplete understanding of the pathophysiology of heart failure, misdiagnoses, suboptimal use of evidence-based therapies, and a lack of a clinically useful, accurate, and consistent means of assessing one’s cardiovascular physiology in real-time. The NICaS utilizing the ICG technology provided by NI-Medical could be just the solution to address all of these limitations.
The Cardiac 360 program incorporates an interdisciplinary team approach to reducing heart failure admissions and re-admissions from the nursing home back to the hospital. Physicians and nurse practitioners are trained in advanced principles of cardiovascular hemodynamic as well as the pathophysiology of heart failure. In addition, the team receives weekly case based learning applying these principles and ICG results towards the effective management of heart failure patients. The program is overseen both by a cardiologist with extensive experience in managing heart failure patients and a board certified physician in geriatric medicine.
From a clinical standpoint, NICaS is able to provide accurate (highly correlated with invasive hemodynamic monitoring), consistent, and real-time data of one’s cardiovascular physiology.
This would facilitate the ability to improve our understanding of one’s cardiovascular state, provide a clue as to what in causing the current state, facilitate titration of medications to more optimal levels, and provide a means of assessing one’s response to medication adjustments.
When coupled with a physician or nurse practitioner with a strong understanding of basic cardiovascular physiology, the NICaS device has the potential to revolutionize the management of heart failure in the NH setting and to, more importantly, improve outcomes for residents with this dreaded syndrome.
With this introduction in mind, we piloted the Cardiac 360 Program to improve outcomes (as assessed by reduced readmissions to the hospital for heart failure). We identified approximately 40 residents with a history of heart failure. A baseline NICaS measurement was obtained in all residents. Subsequent NICaS assessment was based on the type of resident (short vs. long term), the current clinical condition, the goal of therapy, and the baseline scan. If possible, NICaS scans were performed at regular frequencies (weekly if short-term or weekly if long-term until the resident was deemed stable then at longer intervals ranging between 2-4 weeks).
The results of the program were quite impressive. There were no readmissions to the hospital from either site for heart failure in over 6 months. The majority of residents could be optimally titrated on evidence-based medications for heart failure and taken off medications that were not addressing the pathophysiology of the resident as suggested by the NICaS analysis. In addition, we had numerous reports of residents subjectively feeling better and of objective clinical improvement of many residents by the NH staff.
A few things are clear in our opinion:
- The Cardiac 360 Program utilizing NICaS technology provided by NI-Medical can effectively provide Readmission Reduction, reduce heart failure admissions and readmissions from the nursing home back to the hospital;
- The physician or nurse practitioner must understand the NICaS reading and common reasons for abnormalities encountered. The NICaS alone is insufficient to guide patient care without the proper training;
- The NICaS is accurate, but more importantly, it is consistent. This allows one to assess the clinical response to medication adjustments in a resident over time;
- The NICaS takes the guesswork out of managing difficult residents with heart failure. It facilitates expeditious optimization of these residents;
- It affords a comfort level for medication titration not previously seen in these residents;
- The use of NICaS will, undoubtedly, result in less unanticipated discharges from the NH for decompensated heart failure when used by properly trained clinicians;
- NICaS will identify residents with impending heart failure before they decompensate allowing time to make necessary adjustments that will prevent the decompensation.
Non Invasive Hemodynamic Monitoring
Our approach for Hemodynamic monitoring includes noninvasive measurements of hemodynamic parameters by the Non Invasive Cardiac System (NICaS) and trend the data by the Hemodynamic Navigator™. The Hemodynamic Navigator™ is a novel multi-dimensional representation of the cardiovascular status. It provides a good understanding of the interrelations between the cardiac power and the vascular resistance, Hans enables to guide therapy of many cardiovascular syndromes into a better hemodynamic state.
The Hemodynamic Navigator consists of 2 graphs: Cardiovascular status and cardiac function.
The Cardiovascular status graph consists of the Cardiac Output Index (CI) as the X-axis, the Blood pressure as the Y-axis and lines of Total Peripheral Resistance Index (TPRI) and Cardiac Power Index (CPI). In addition, the normal range is marked by green lines. Patient’s cardiovascular status represents by a black dot. A red triangle and a blue square represent the systolic and diastolic blood pressure respectively.

The Cardiac Function graph consists of the Heart Rate (HR) in the X-axis, the Stroke Volume Index (SI) in the y-axis and lines of the Cardiac Output Index (CI). In addition, the normal range is marked by green lines. Patient’s cardiac function represents by a black dot.

The 2 graphs (Cardiovascular Status and Cardiac Function) provide a very clear understanding of patient’s pathophysiology by the location of the black dots. Various areas represent different syndromes, as can be seen on the graph below, while the respond to treatment or trend over time is very clear.
The Hemodynamic Navigator is very effective to manage patients with Hypertension, Congestive Heart Failure (CHF), Patients hospitalized in Internal Medicine and Cardiology departments. In addition, it is an effective tool support drug titration in ICU and ICCU.
Clinical Studies
Hemodynamic response to fluid removal during hemodialysis: categorization of causes of intradialytic hypotension. Nephrology Dialysis Transplantation, Volume 33, Issue 9, 1 September 2018, Pages 1643–1649
Authors:
Nathan W Levin, Marcia H F G de Abreu, Lucas E Borges, Helcio A Tavares Filho, Rabia Sarwar, Surendra Gupta, Tahir Hafeez, Shaul Lev, Caroline Williams
http://onlinelibrary.wiley.com/doi/10.1111/hdi.12589/abstract
Comparison of stroke volume measurements during hemodialysis using bioimpedance cardiography and echocardiography.Hemodialysis International. 10 August 2017. DOI:10.1111/hdi.12589
Authors:
Michael J. Germain, Jyovani Joubert, Daniel O’Grady, Brian H. Nathanson, Yossi Chait, Nathan W. Levin
http://onlinelibrary.wiley.com/doi/10.1111/hdi.12589/abstract
A Phase 2a dose-escalation study of the safety, tolerability, pharmacokinetics and haemodynamic effects of BMS-986231 in hospitalized patients with heart failure with reduced ejection fraction. Eur J of Heart Failure. 2017 Jul 5.
Authors:
Tita C, Gilbert EM, Van Bakel AB, Grzybowski J, Haas GJ, Jarrah M, Dunlap SH, Gottlieb SS, Klapholz M, Patel PC, Pfister R, Seidler T, Shah KB, Zieliński T, Venuti RP, Cowart D, Foo SY, Vishnevsky A, Mitrovic V
http://onlinelibrary.wiley.com/doi/10.1002/ejhf.897/full
The Hemodynamics of Labor in Women Undergoing Vaginal and Cesarean Deliveries as Determined by Whole Body Bioimpedance. Am J Perinatolog. DOI: 10.1055/s-0037-1606368
Authors:
Eran Ashwal, Shiri Shinar, Sharon Orbach-Zinger, Shaul Lev, Roi Gat, Liron Kedar, Yehuda Pauzner, Amir Aviram, Yariv Yogev, Liran Hiersch
https://www.thieme-connect.com/products/ejournals/abstract/10.1055/s-0037-1606368
Cardiac hemodynamics before, during and after elective cesarean section under spinal anesthesia in low-risk women. J Perinato. 2017 Jul; 37(7): 793-799
Authors:
Maya Ram, Anat Lavie, Shaul Lev, Yair Blecher, U Amikam, Yael Shulman, Tomer Avnon, Eran Weiner, Ariel Many
https://www.ncbi.nlm.nih.gov/pubmed/28406485
Casting doubt on the value of assessing the cardiac index in pregnancy. J Matern Fetal Neonatal Medication. 2017 Aug 13:1-5
Authors:
Ram M, Lavie A, Lev S, Blecher Y, Amikam U, Shulman Y, Avnon T, Weiner E, Many A
https://www.ncbi.nlm.nih.gov/pubmed/28805112
Y.Matsuda et al. Perioperative sequential monitoring of hemodynamic parameters in patients with pheochromocytoma using the NICaS. Endocrine J. 2014
Yu Taniguchi et al. Noninvasive and Simple Assessment of Cardiac Output and Pulmonary Vascular Resistance With Whole-Body Impedance Cardiography Is Useful for Monitoring Patients With Pulmonary Hypertension, Circulation Journal, June 12,2013
http://www.ncbi.nlm.nih.gov/pubmed/23759655
Yoseph Rozenman et al, Detection of left ventricular systolic dysfunction using a newly developed, laptop based, impedance cardiography index, International Journal of Cardiology Volume 149, Issue 2: 248-250, 2 June 2011
http://www.internationaljournalofcardiology.com/article/S0167-5273%2811%2900190-2/abstract
G Cotter, A Schachner, L Sasson, H Dekel and Y Moshkovitz. Impedance cardiography revisited (comparison to Thoracic Impedance). Physiological Measurement 27 (2006) 817-827, July 2006
Yusuke Tanino et al. Whole Body Bioimpedance Monitoring for Outpatient Chronic Heart Failure Follow up, circulation Journal 73:1074-1079, June 2009
http://www.ncbi.nlm.nih.gov/pubmed/16868348
Marina Leitman et al. Non-invasive measurement of cardiac output by Whole-body bio-impedance during dobutamine stress echocardiography: Clinical implementations in patients with left ventricular dysfunction and ischemia. The European Journal of Heart Failure 8 (2006) 136-140
Oscar Luis Paredes et al. Impedance Cardiography for Cardiac Output Estimation – Reliable of Wrist-to-Ankle Electrical Configuration –. Circulation Journal 2007; 70: 1164-1168, September 2006
http://www.ncbi.nlm.nih.gov/pubmed/16936430
Gad Cotter, Yaron Moshkovitz, Edo Kaluski, Amram J. Cohen, Hilton Miller, Daniel Goor and Zvi Vered. Accurate, Noninvasive Continuous Monitoring of Cardiac Output by Whole-Body Electrical bioimpedance. CHEST 2004;125;1431-1440
http://www.ncbi.nlm.nih.gov/pubmed/15078756
Guillermo Torre-Amiot et al. Whole-Body Electrical Bio-Impedance is accurate in Noninvasive Determination of Cardiac Output: A Thermodilution controlled, Prospective, Double Blinded Evaluation. European Journal of Heart Failure, June 2004

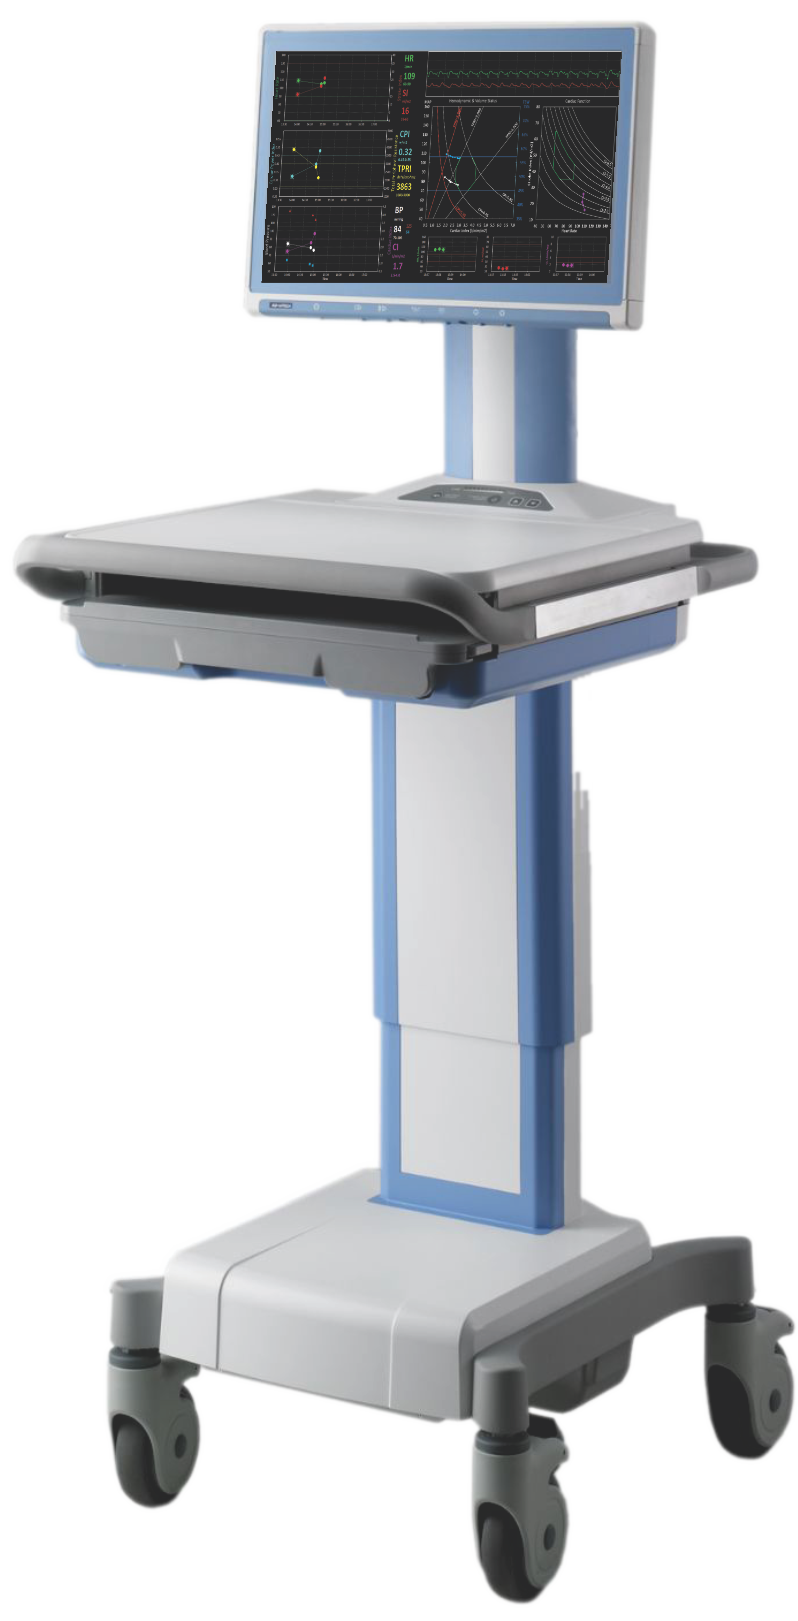
A New Age in Impedance Cardiography
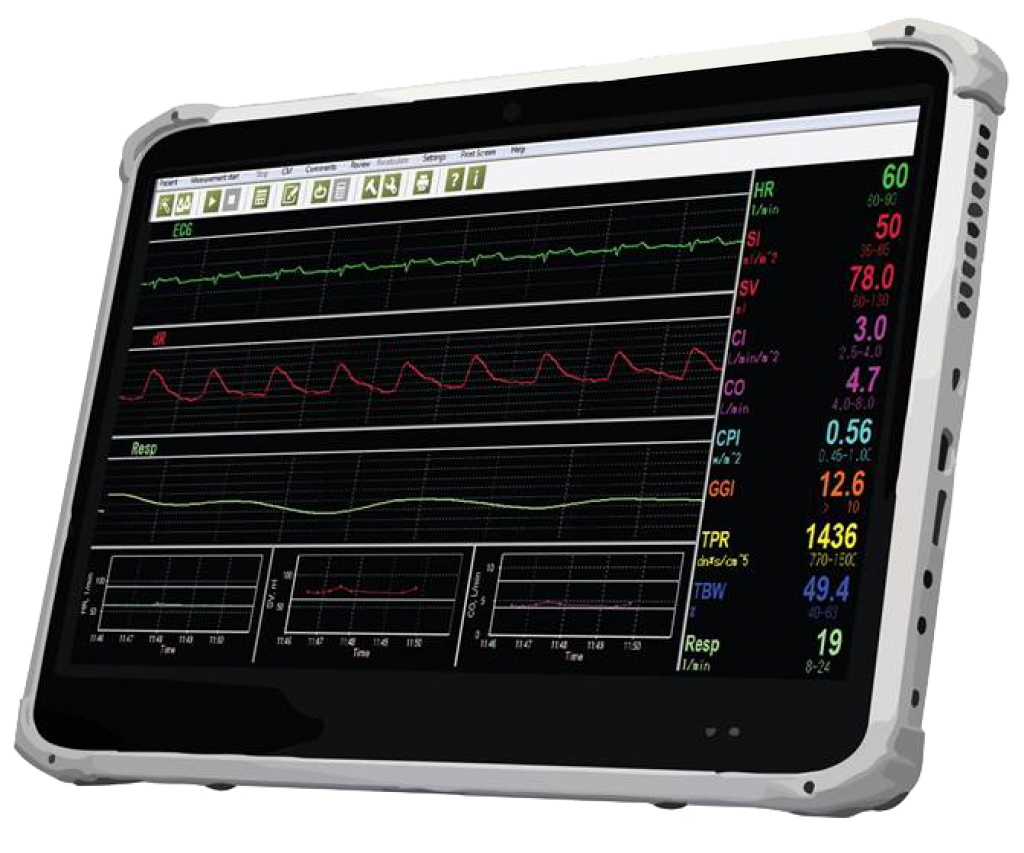
NICaS Touch Screen Configuration
NICaS screens
- Standard Screen – designed to take a single measurement.
- Comparative Screen – designed to compare cardiac function in different patient’s situations.
- Trending Screen – designed for continuous monitoring of patient’s cardiovascular and fluid status.